
You're spending $2,000 a month on marketing. The phone rings. Sometimes you answer, sometimes you don't. Calls come in, but do they convert? You honestly don't know.
That's the problem with flying blind on call performance. Without data, you're guessing—about which marketing works, about whether you're answering enough calls, about whether those calls are turning into revenue.
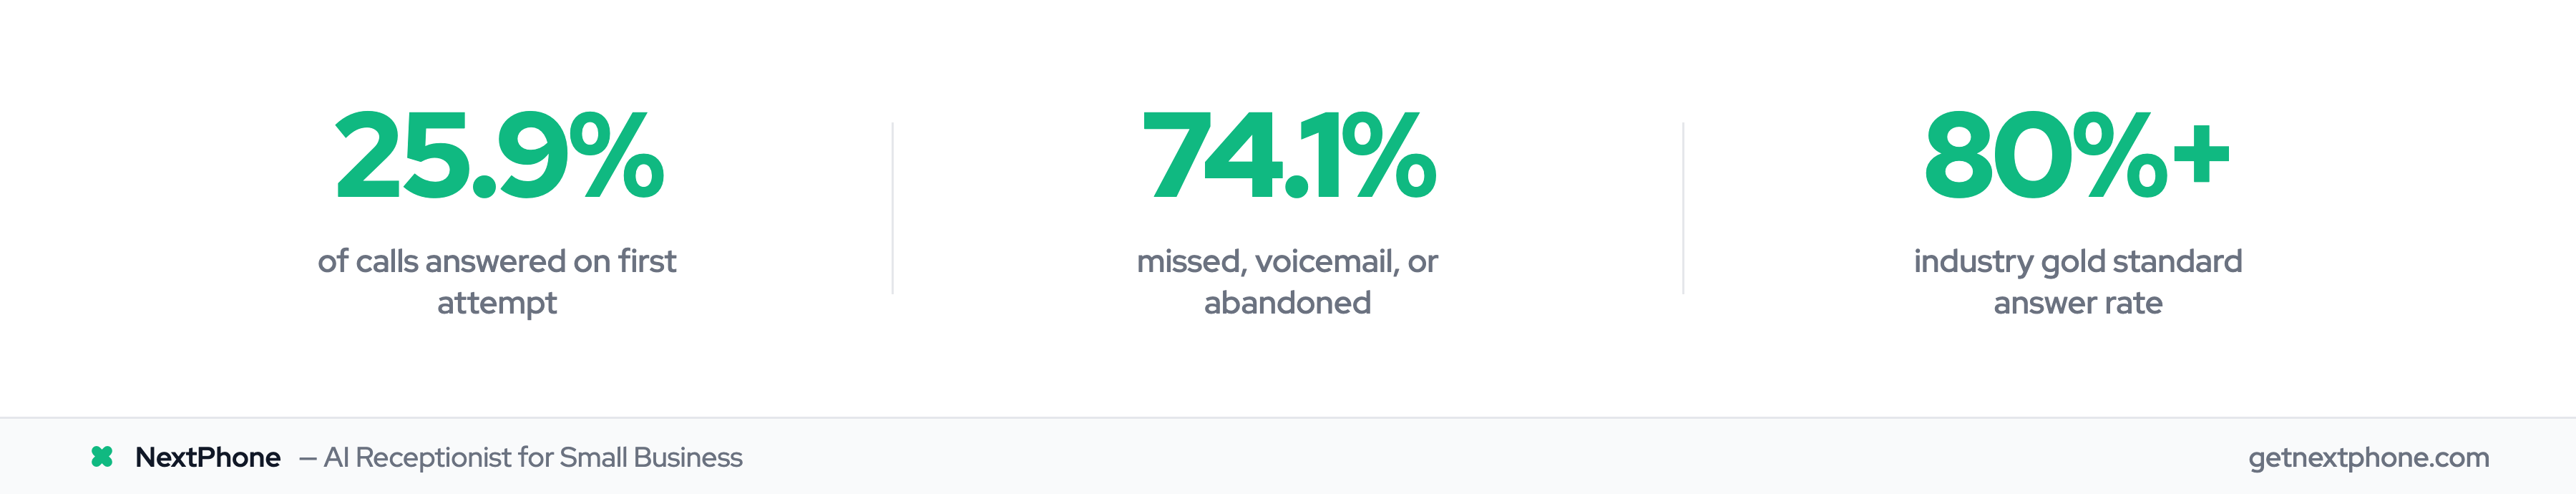
In our analysis of 130,175 calls to home services businesses, only 25.9% were answered on the first attempt. The other 74.1%? Voicemail, missed, or abandoned. That's not a minor gap—that's a leaky bucket losing thousands per month.
This playbook gives you the 8-10 metrics that actually matter for small business, a simple weekly review process, and optimization strategies to turn data into action.
Why You Can't Afford to Ignore Call Data
Phone calls represent your highest-intent leads. Someone picking up the phone to call your business is 3x more likely to convert than someone filling out a web form. They want to talk now, not wait for an email response.
But here's the uncomfortable truth: 67% of customers hang up if they can't reach a real person quickly. And 60% of local searchers prefer calling over forms or chat. Most small businesses have no idea how often they're missing these high-intent leads.
Without call analytics, you can't answer basic questions:
- Are we answering calls fast enough?
- Which marketing channels actually drive calls?
- Are those calls converting to appointments?
- When are we missing the most calls?
In our study, the math on missed calls was brutal. For a typical contractor receiving 42 calls per month, 74.1% going unanswered meant 31 missed opportunities. At even modest conversion rates, that's $21,700 per month in lost revenue—invisible, unmeasured, and unrecovered.
You can't fix what you don't measure.
The 8 Call Metrics That Actually Matter
Enterprise call centers track 50+ KPIs—and 85% of call center managers are now implementing conversation intelligence to make sense of it all. You don't need that complexity. For small business, eight core metrics tell you everything essential.
1. Answer Rate
Definition: Percentage of calls answered vs. total incoming calls Target: 80%+ (industry gold standard) Why it matters: Every unanswered call is a potential customer calling your competitor instead
2. Missed Call Count
Definition: Raw number of unanswered calls per day/week Target: Less than 5 per day for most small businesses Why it matters: Even with a good percentage, the absolute number of missed leads matters
3. Average Handle Time
Definition: How long each call lasts on average Target: 2-4 minutes for most service businesses Why it matters: Too short might mean callers aren't getting answers; too long might mean inefficiency. 68% of agents spend 10-29% of their time on manual after-call work—time that could be spent on calls
4. Booking Rate
Definition: Percentage of calls that result in scheduled appointments Target: 30-40% for service businesses Why it matters: This is the ultimate conversion metric—calls to revenue. For call centers, the related metric is First Call Resolution (FCR), where the best benchmark is 70-79%.
5. Transfer Rate
Definition: Percentage of calls that need human handoff (if using AI) Target: Less than 20% Why it matters: High transfer rates mean your AI or front-line isn't handling enough
6. Lead Capture Rate
Definition: Percentage of calls where contact information is collected Target: 90%+ Why it matters: Even if you can't book now, capturing info enables follow-up
7. Call Volume by Time
Definition: Number of calls broken down by hour and day Target: No target—this is for pattern identification Why it matters: Shows when you need coverage and when you're overstaffed
8. Call Source
Definition: Which marketing channel or search drove each call Target: Track all sources Why it matters: Proves marketing ROI and guides budget allocation. Research shows 70% of businesses struggle to act on attribution insights, but those who do see 12% average improvement in lead quality
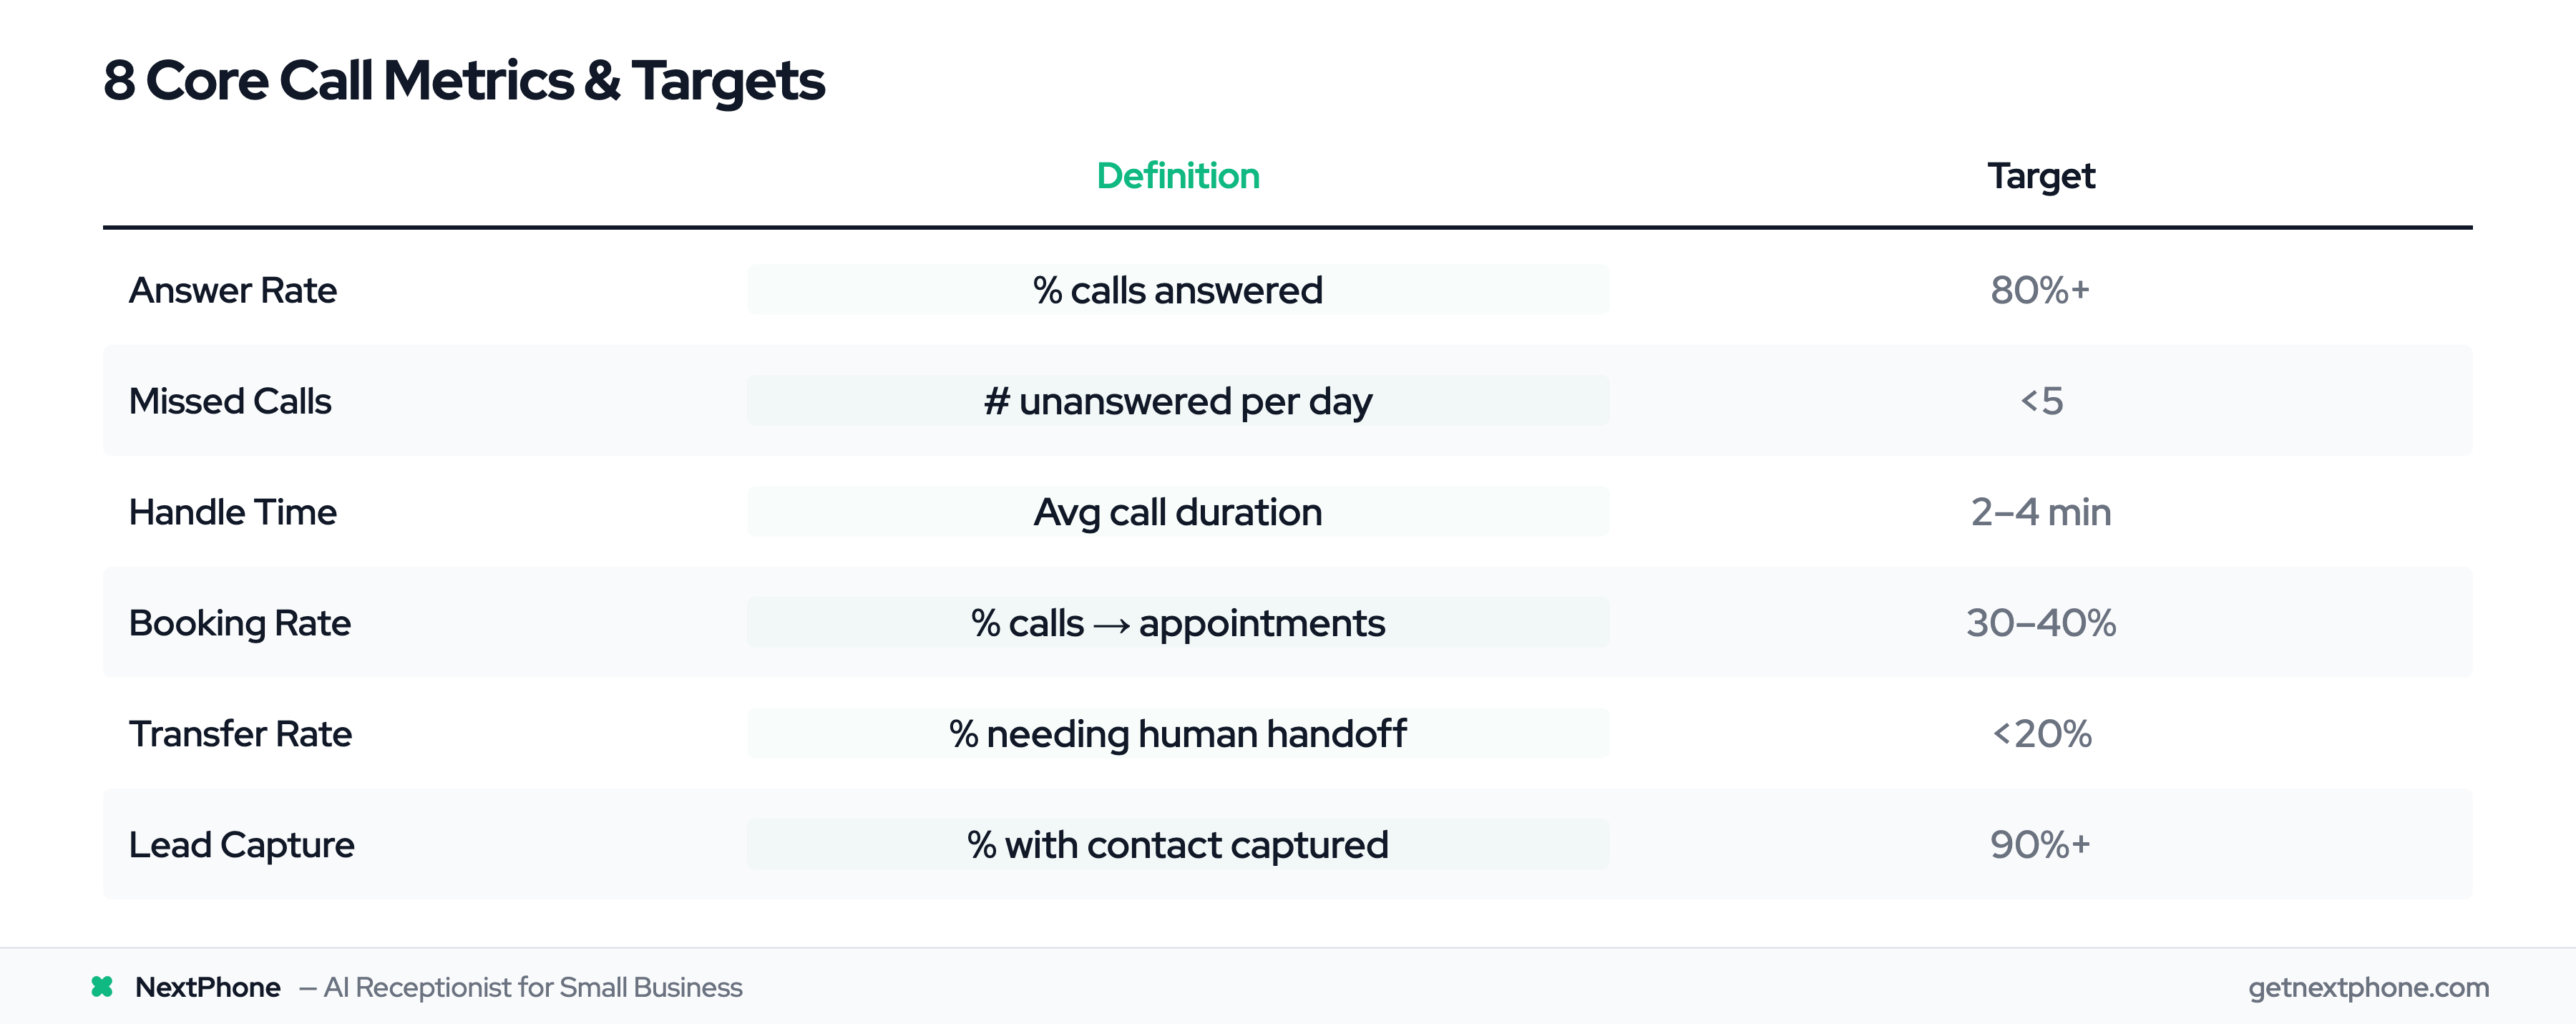
| Metric | Definition | Target |
|---|---|---|
| Answer Rate | % calls answered | 80%+ |
| Missed Calls | # unanswered per day | <5 |
| Handle Time | Avg call duration | 2-4 min |
| Booking Rate | % calls — appointments | 30-40% |
| Transfer Rate | % needing human handoff | <20% |
| Lead Capture | % with contact captured | 90%+ |
| Volume by Time | Calls per hour/day | Identify patterns |
| Call Source | Channel that drove call | Track all |
What "Good" Actually Looks Like
Knowing the metrics is step one. Knowing what "good" looks like is step two.
Industry Benchmarks
The call center industry standard is 80% of calls answered within 20 seconds. That's the gold standard—what enterprise contact centers are measuring.
For small businesses, reality looks different. Our analysis of 130,175 calls to home services companies showed only 25.9% answered on the first ring. That's not because these are bad businesses—it's because contractors are on job sites, plumbers are under houses, and HVAC techs are on roofs. The phone rings, and no one can pick it up.
Your Baseline
Before you set targets, measure where you're starting. Run analytics for 30 days without making changes. That's your baseline—the honest picture of current performance.
Don't compare yourself to enterprise call centers with dedicated staff. Compare yourself to yourself, then aim to improve.
Realistic Improvement Targets
Set quarterly improvement goals:
- Quarter 1: Improve answer rate by 10 percentage points
- Quarter 2: Reduce missed calls by 25%
- Quarter 3: Increase booking rate by 5 percentage points
- Quarter 4: Achieve 80% answer rate
Progress beats perfection. A business that improves from 30% to 50% answer rate has doubled their opportunity capture—even if they're still below the "industry standard."
Building a Simple Call Analytics Dashboard
You don't need enterprise software. You need visibility.
Built-In Platform Analytics
Most AI receptionist platforms (including NextPhone) include analytics dashboards out of the box. Before building anything custom, check what your existing tools provide:
- Call volume over time
- Answer rate trends
- Missed call log
- Average handle time
- Call recordings
If your platform has these, you might not need anything else.
Google Data Studio Integration
For custom dashboards, Google Data Studio (now Looker Studio) is free and connects to most data sources. Build a simple dashboard with:
- Daily call volume chart
- Week-over-week answer rate comparison
- Call source breakdown pie chart
- Missed calls by time of day heatmap
Start with four visualizations. You can always add more later.
Don't Over-Engineer
The goal is insight, not sophistication. A simple spreadsheet tracking weekly metrics is better than an elaborate dashboard no one looks at.
If you spend more time building the dashboard than reviewing it, you've missed the point.