
"I didn't even know I was missing that many calls until I saw the data. I just thought business was slow."
That's what a plumber told us after seeing his call analytics dashboard for the first time. He'd been in business for eight years. He figured he got maybe 30-40 calls a month. Reality? 76 calls last month. He answered 18. He missed 58 potential customers and had no idea.
In our analysis of 130,175 customer service calls from 45 home services contractors over 7 months, we found that 74.1% of calls went completely unanswered. Three out of every four calls just disappeared into the void. No callback, no voicemail, no record. Invisible.
You can't fix what you can't see. That's where call analytics dashboards come in.
See your call analytics in action with NextPhone —
The Problem: You Can't Fix What You Can't See
Flying Blind on Call Performance
Most small contractors have zero visibility into their call performance. They answer calls when they can. They miss calls when they're busy. And they have absolutely no idea what's actually happening.
No data on how many calls they're getting. No clue which calls they're missing. No insight into what time calls come in. No tracking of whether callback requests get followed up.
You're essentially flying blind.
What You Don't Know Is Costing You
Here's what happens when you're working without call analytics:
You think business is slow, but you're actually getting 67 calls a month. You're just missing 53 of them because you're on job sites, under houses, on roofs, or handling other calls.
You assume most calls come in the afternoon, so you schedule your availability accordingly. Reality? 60% of your calls come between 9 AM and noon. You're unavailable during your busiest hours.
You promise a customer you'll call them back with a quote. Three more calls come in. By end of day, you've forgotten. They hired someone else. You don't even know you lost the job.
The Guesswork Trap
Without analytics, you're making business decisions based on gut feeling instead of data.
"I think I need to hire help" becomes "The data shows I consistently miss 15+ calls every Tuesday and Wednesday between 10-11 AM."
"Business seems slow this month" becomes "Call volume is down 23% compared to last month, but conversion rate is up 18%."
"I don't know if my ads are working" becomes "47 calls came from Google Ads, 12 converted, $42,000 in revenue tracked directly to that channel." Research shows 70% of businesses struggle to act on attribution insights—analytics dashboards bridge that gap.
The difference between guessing and knowing is a call analytics dashboard.
What Is a Call Analytics Dashboard?
More Than Just a Call Log
A call analytics dashboard is a visual tool that tracks and displays key call data: volume, trends, performance metrics, and patterns.
It's not just a list of calls. That's a call log. A dashboard shows you what the data means. It reveals patterns you can't see in a list. It surfaces insights that help you make better decisions.
According to call center research from CloudTalk, "A call center analytics dashboard is a visual reporting tool that gives teams insight into real-time and historical metrics."
What a Dashboard Tracks
A good call analytics dashboard shows:
Total call volume (daily, weekly, monthly)
- Missed vs answered calls (your capture rate)
- Call duration (average time per call)
- Peak hours (when calls are coming in)
- Call sources (where calls are coming from)
- Caller information (name, number, reason for call)
- Callback requests (who asked you to call them back)
- Emergency/urgent calls (calls that need immediate attention)
Instead of wondering "Did we miss calls this week?", you see: "42 calls Monday-Friday. 31 missed. Peak hours: 9-11 AM. 7 callback requests. 3 marked urgent."
That's actionable intelligence.
Enterprise vs Small Business Dashboards
Here's where most call analytics solutions go wrong for small businesses: they're built for enterprise call centers.
Enterprise dashboards track metrics like Average Handle Time (AHT), First Call Resolution (FCR), Customer Satisfaction Score (CSAT), and Service Level Agreement (SLA) compliance. According to ICMI's 2025 research on what contact centers are measuring, larger operations focus heavily on these KPIs. These are designed for teams with 50+ agents, quality assurance managers, and real-time supervisors.
If you're a 1-5 person contractor team, you don't need to know your average handle time down to the second. You need to know: Are we answering calls? When are we busiest? Which calls are emergencies? (For reference, ICMI's Call Center Metrics KPIs Guide covers enterprise-level metrics in depth—most of which are overkill for small businesses.)
Small business dashboards focus on practical metrics that drive real decisions, not complex KPIs that require a data analyst to interpret.
6 Metrics Small Businesses Should Track
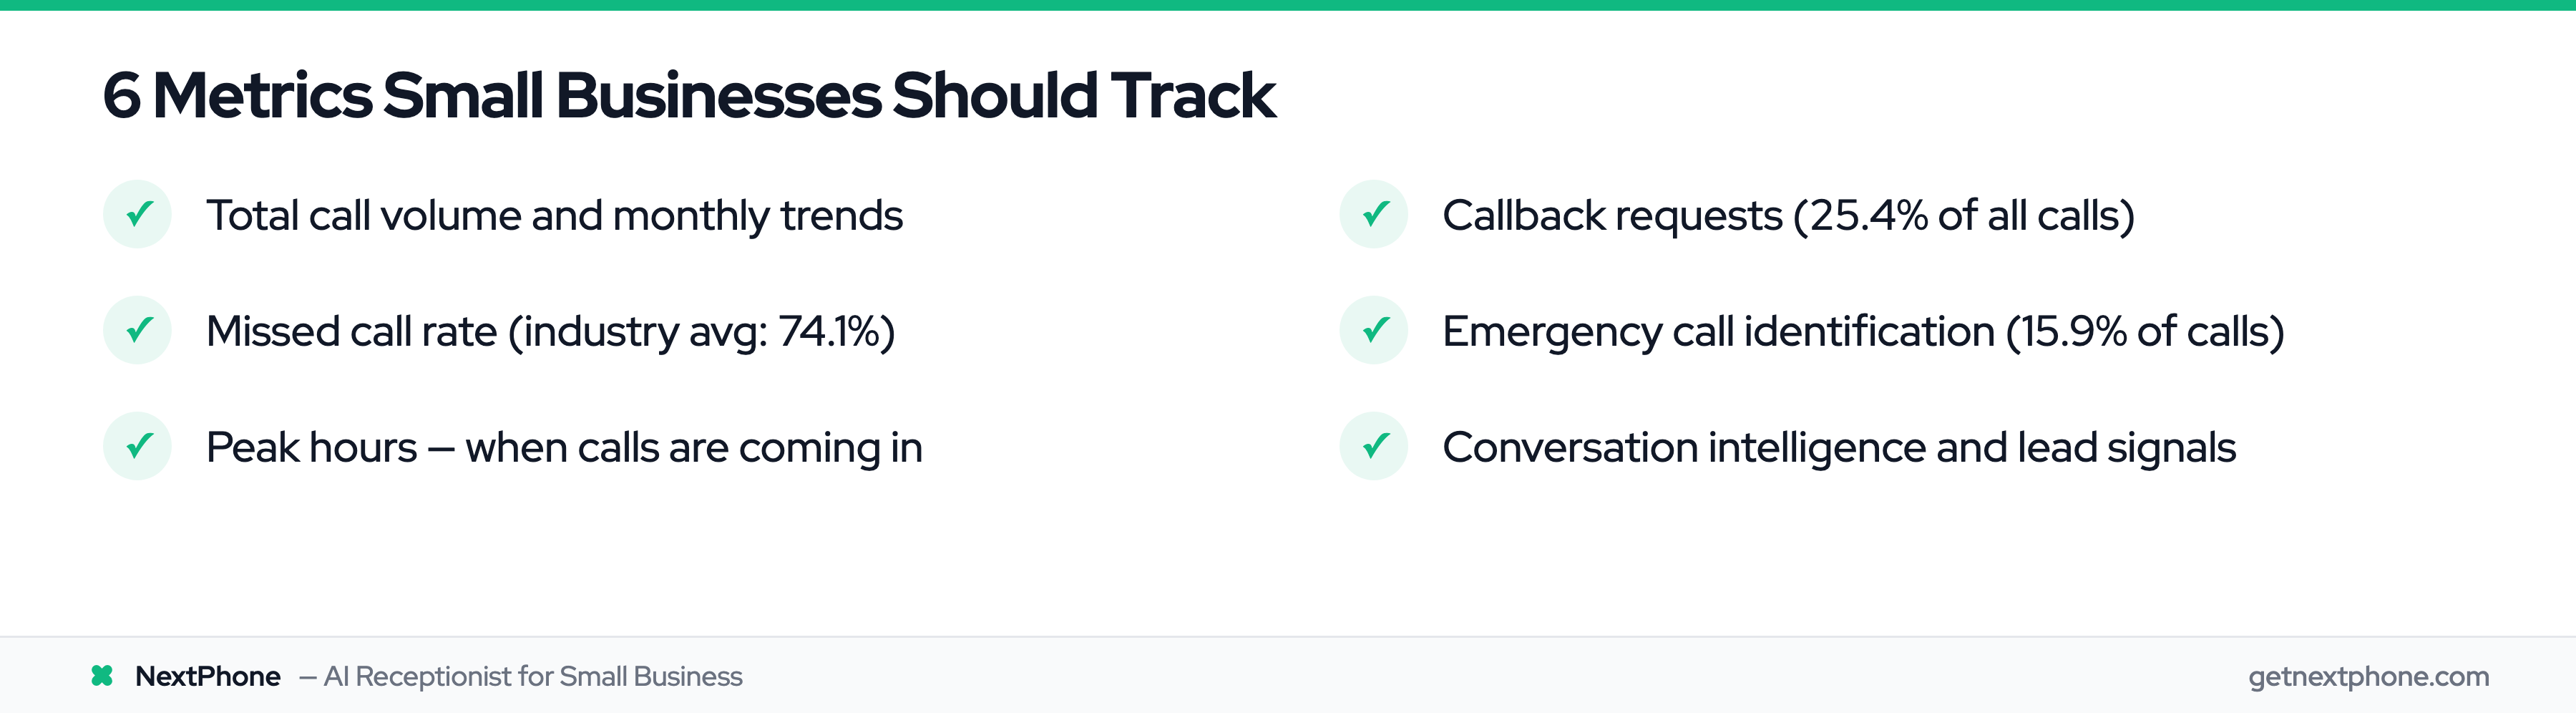
1. Total Call Volume & Trends
Track your total calls per day, week, and month. See if volume is growing, declining, or holding steady.
More importantly, look for seasonal patterns. Roofers see call spikes during storm season. HVAC contractors get slammed in summer (AC failures) and winter (heating emergencies). Landscapers have a spring rush.
When you know your patterns, you can plan ahead. Hire seasonal help before the rush hits. Order inventory in advance. Block your calendar during busy periods.
For context: In our dataset, the average home services contractor receives 42 calls per month. According to research from Nuacom, "Receiving more than 100 to 150 calls a day is often seen as high volume for many businesses."
If you're getting 40-50 calls a month, you're right in the typical range. If you're getting 100+, you're in growth mode and probably need help.
2. Missed Call Rate
This is the most critical metric for small businesses.
Our data shows a 74.1% average missed call rate across home services contractors. That means three out of four calls go unanswered.
Every missed call is potential lost revenue. A missed estimate request. A missed emergency job. A missed new customer.
Your dashboard should show exactly which calls you answered and which ones you missed. Not just the count, but the details: who called, when, what they needed.
3. Peak Hours & Patterns
When are most of your calls coming in?
According to research on peak hour traffic, "Mondays often witness higher call loads due to weekend accumulations, while lunchtime and early evenings are peak hours."
But your business might be different. Your dashboard shows your patterns.
An electrical contractor we worked with discovered 67% of his calls came between 8 AM and noon. He was scheduling jobs in the morning and checking his phone in the afternoon. He had it backwards. Once he saw the data, he adjusted his availability. Missed call rate dropped from 71% to 22%.
Peak hour data answers questions like:
- When should I be available vs out in the field?
- When should I hire part-time help?
- When can I schedule deep work without missing calls?
4. Callback Requests
In our analysis of 130,175 calls, 25.4% of customers explicitly requested callbacks. That's roughly 1 in 4 calls.
"Can you call me back with a quote?" "I'll be home after 5, can you call then?" "Email me an estimate and give me a call to discuss."
Without a system to track these requests, 80% of callbacks never happen. You promise to call. You get busy. You forget. Customer moves on.
A dashboard tracks every callback request. Shows who requested it, when, and what they need. Creates accountability. Ensures follow-up.
Our calculation: For a typical contractor with 42 calls/month, that's 11 callback requests. If 80% are forgotten (9 lost leads), and 30% would have converted at $3,500 average job value, that's $9,450 per month in lost revenue. Or $113,400 per year.
All because you didn't write it down.
5. Emergency Call Identification
15.9% of calls in our dataset contained urgency language: "emergency," "urgent," "ASAP," "right away."
These aren't routine inquiries. These are high-value, time-sensitive calls. Burst pipes. Power outages. AC failures in 95-degree heat. Roof leaks during storms.
Emergency jobs average $4,200 in our data, compared to $3,500 for routine work.
Without analytics, emergency calls get buried in your call log. They look like every other missed call. But they're not. They're your highest-value opportunities, and customers won't waitthey're calling down the list until someone answers.
A dashboard with emergency flagging automatically identifies these calls so you can prioritize them.
6. Conversation Intelligence & Lead Signals
Modern call analytics platforms use AI to analyze what was actually said on the call.
The AI detects signals like:
- Budget mentioned ("I have about $5,000 to spend")
- Timeline specified ("I need this done by next week")
- Competitor mentioned ("I called ABC Plumbing but they're booked")
- Ready to book ("What's your first available appointment?")
According to CallMiner's research on conversation analytics, "Sentiment analysis monitors conversations and evaluates language and voice inflection to quantify the attitudes and opinions of an individual speaker."
This helps you prioritize. A caller who says "just getting quotes" is different from a caller who says "I need this fixed today, when can you come?"
Both are leads. But one is hot, one is warm. Knowing the difference helps you follow up in the right order.
Real-Time Dashboards vs Daily Call Digests
The Enterprise Model (Real-Time Monitoring)
Enterprise call centers use real-time dashboards. Live metrics. Constant monitoring. Managers watching screens all day, tracking agent performance, queue times, service levels.
According to TheLevel.ai's dashboard research, "Real-time monitoring allows managers to see live metrics like active calls, agent statuses, wait times, and service levels."
That works great if you have dedicated managers sitting at desks monitoring operations.
The Contractor Model (Daily Digest Email)
But if you're a plumber under a house, an electrician in an attic, or a roofer on a roof? You're not monitoring a real-time dashboard.
The small business model is different: daily digest emails.
Every morning, you get one email with yesterday's complete call summary:
- Total calls
- Missed calls
- Answered calls
- Callback requests
- Emergency flags
- Brief summary of each conversation
- Action items
You check it over morning coffee. See what happened yesterday. Prioritize your follow-ups. Get to work.
Which One Actually Gets Used
Real-time dashboards look impressive. Daily digests feel too simple.
But here's the reality: contractors use daily digests. They ignore real-time dashboards.
Why? Because you're not sitting at a desk. You're working. The last thing you need is another app to check constantly.
What you actually need: "Yesterday you got 7 calls. You missed 3. Two people requested callbacks. Mrs. Johnson called about an emergency water heater leak at 9 PM."
That's useful. That's actionable. That gets read.
5 Ways Call Analytics Improve Your Bottom Line
1. Visibility Prevents Lost Revenue
When you can see exactly how many calls you're missing, you can actually do something about it.
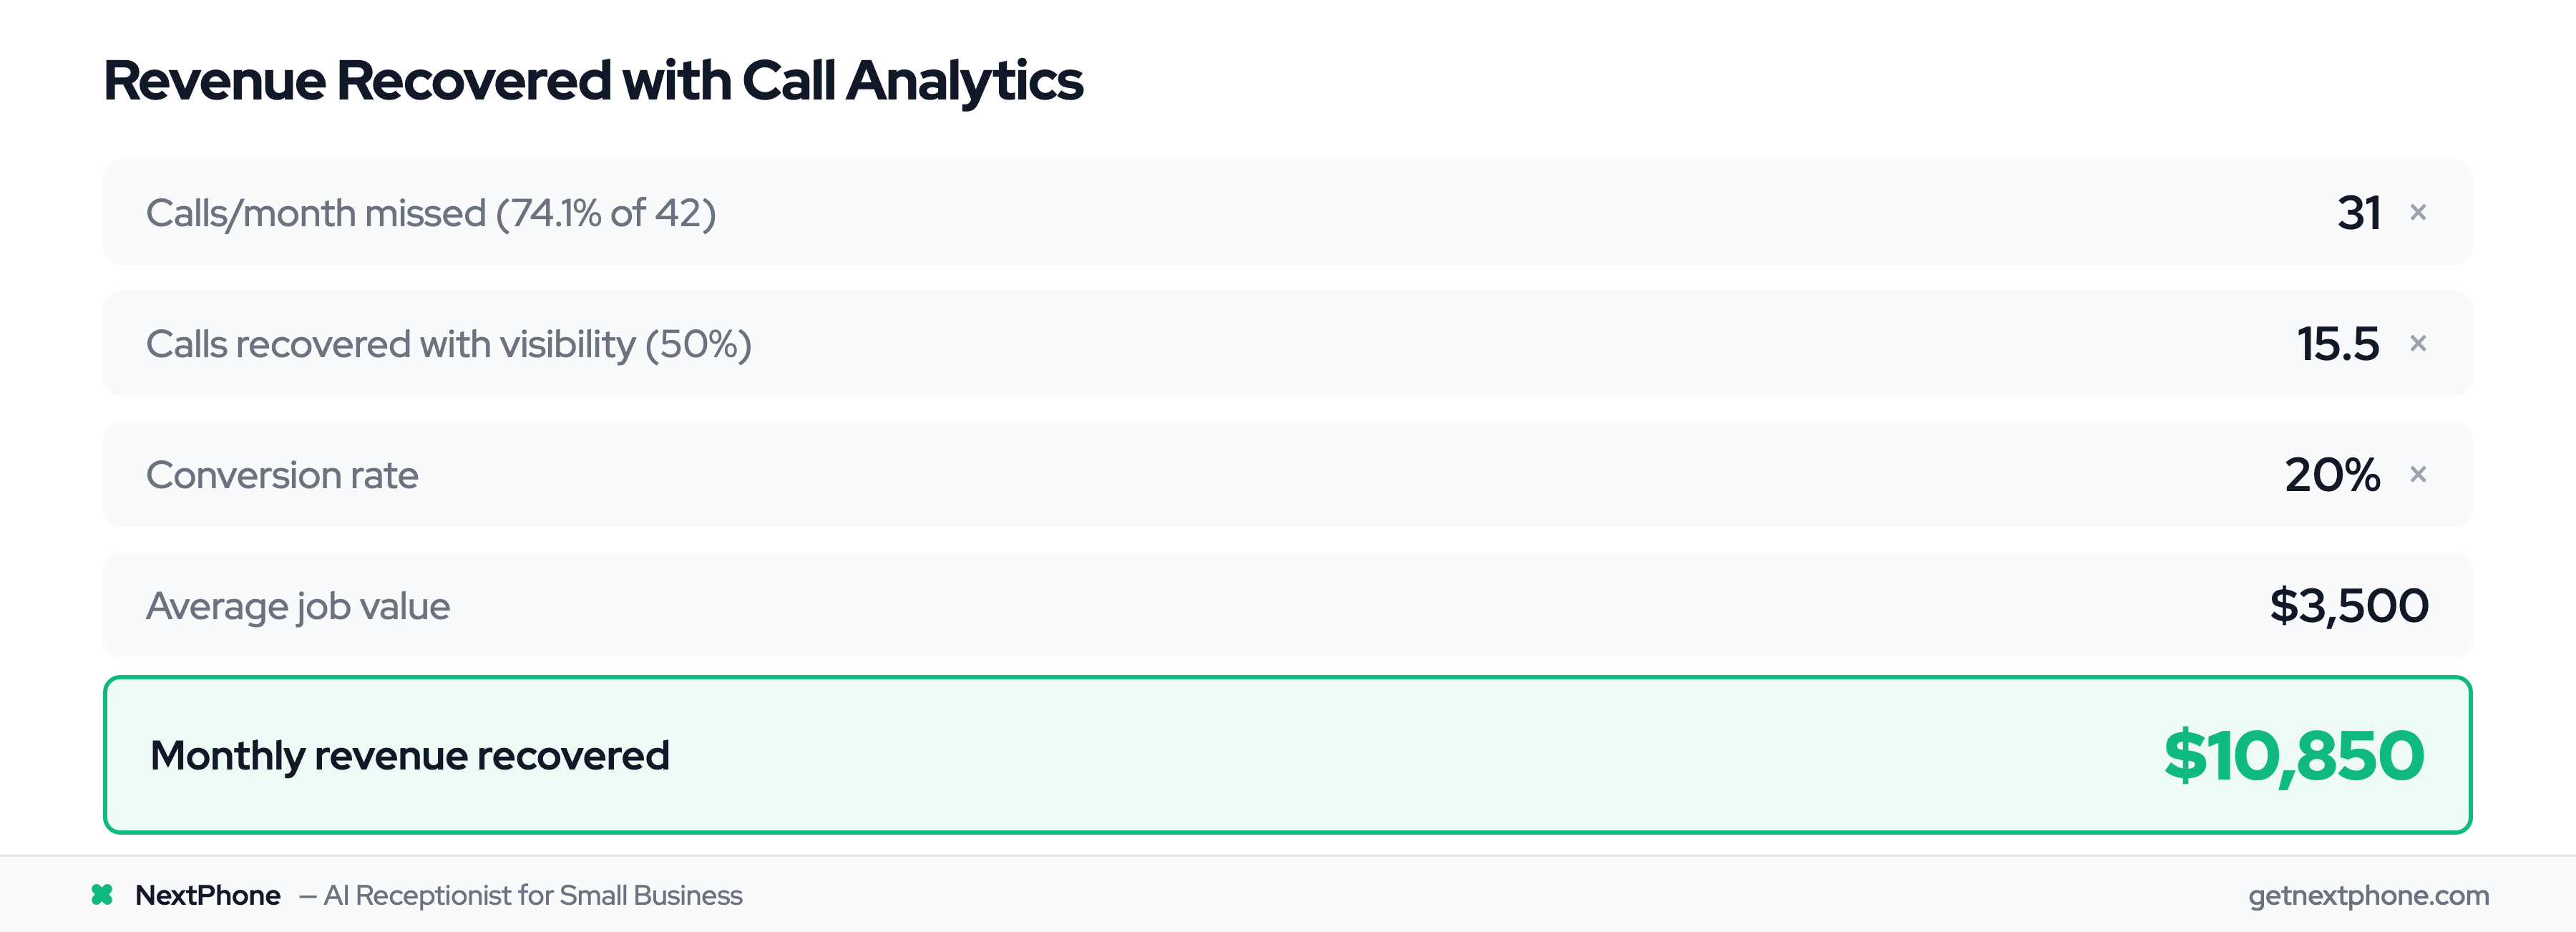
Here's the ROI calculation:
- Average contractor: 42 calls/month
- Industry average: 74.1% missed = 31 missed calls/month
- With analytics visibility, you call back promptly and recover 50% = 15.5 recovered calls
- Conservative 20% conversion rate — $3,500 average job
- Recovered revenue: $10,850 per month = $130,200 per year
Cost of analytics: $199/month = $2,388/year
ROI: 5,354%
Visibility alone pays for itself 54 times over.
2. Identify When to Hire Help
Peak hour data shows you exactly when you're overwhelmed.
Let's say your dashboard reveals:
- 60% of calls come between 9 AM - 12 PM
- You consistently miss 15+ calls during this window
- You're on job sites and can't answer
That's your hiring trigger. Bring in part-time help for mornings only.
The math:
- Part-time helper: $1,200/month
- Captures 10 extra calls/month during peak hours
- 25% conversion rate — $3,500 average
- Revenue: $8,750/month = $105,000/year
- Cost: $14,400/year
- Net gain: $90,600/year
Without the data, you're guessing. "Should I hire?" becomes "I'm definitely missing money by not having coverage from 9-12."
3. Prepare for Seasonal Spikes
Historical call data shows seasonal patterns you can plan around.
A roofing contractor in Texas saw this pattern in his dashboard:
- March-May: Average 35 calls/month
- June-September (storm season): 89 calls/month
- October-February: 28 calls/month
He now hires two seasonal helpers in May, before the rush. Orders extra materials in April. Blocks his calendar for storm work June-September.
Before analytics? He scrambled every summer, turned away work, and left money on the table because he couldn't handle the volume.
4. Never Forget a Callback Again
Remember: 25.4% of calls include callback requests. Without tracking, 80% are forgotten.
A callback tracking dashboard shows:
- Who requested a callback
- When they called
- What they need
- Whether you've called them back yet
Creates accountability. Ensures follow-up. Turns "I'll try to remember" into "These 4 people need callbacks today."
According to CallTrackingMetrics research, "By tracking phone leads alongside other ad campaigns, you can show the full picture of campaign successes and how they're contributing to ROI."
Preventing just 3-4 forgotten callbacks per month recovers $10,000+ in revenue annually. For most contractors, that alone justifies the cost of analytics.
5. Prioritize Hot Leads
Not all calls are created equal.
Conversation intelligence identifies high-intent signals:
- Budget mentioned
- Timeline specified
- Urgency expressed
- Ready to schedule
An HVAC contractor used this feature to change how he follows up. Before: First come, first served. After: Hot leads first, routine inquiries later.
Result? Conversion rate jumped from 18% to 29%. Same number of calls. Better prioritization. More revenue.
When you know which leads are ready to buy and which are "just browsing," you can focus your time where it matters most.
Stop flying blind on your call performance. Try NextPhone free for 7 days —